
If you have a reservoir, the Water Board requires you to measure and report: how much you divert to it, how much water you store in it by month, and how much water you release if the pond has a controllable outlet. It is usually not possible (or at least not feasible) to measure the inflow, so what is actually reported is the monthly positive change in storage, the amount that fills it up.
If your reservoir is less than 10 acre-feet (AF) per year, you only have to report it. Measurement is not required.
How do you know how much is stored in your reservoir? Each pond needs an elevation-storage table or curve, as the Water Board calls it. Engineers call it an area-capacity table or curve – that’s what I created during part of my career as a water bureaucrat. I’ll use the Water Board’s terminology here since water diversions and storage are reported to them.
First check to see if the Water Board or Division of Safety of Dams has an inspection report for your reservoir. If not that, then an elevation-storage table or curve may be available. You can have it emailed as a PDF. If there is no information for your reservoir, then you have to create the table and curve yourself.
First a reservoir has to be surveyed, so you know how full it is for any given elevation of water. The elevations start at zero storage. The figure below shows a cross section and the contour map for a reservoir with a minimum elevation of 86 feet.

How do you survey a reservoir? You could hire an engineer or surveyor to survey it. Depending on your budget and your need for accuracy, the elevation-storage table from a survey could be anywhere from +/- 5%, to +/- 10% accurate. The Water Board requires +/- 10% for larger reservoirs, and +/- 15% for 100 acre-foot (AF) or smaller reservoirs. I recommend aiming for +/- 5% in case you have significant errors elsewhere in the measurement system.
On the high end, the survey could be done using GPS survey instruments, so the result could be accurate and could overlay other digital maps. Almost as high a cost is to have a transit with EDM (electronic distance measurement). Robotic units only require one person acting as the rodman, and the instrument “follows” by keeping pointed at the laser prism reflector.
At the bottom end of the scale, a survey level or possibly a hand level, and a couple of 100′, 200′, or 300′ tapes can be used. Many survey levels can read horizontal angles within a degree or two, so the instrument person can note angle and distance to every point. If angles are not used, then two tapes are used, one to measure the distance along a side, the other to measure perpendiculars out to the rodman. In the boat, the rodman measures depths, and on land he has a telescoping level rod to get elevations above the  water level. This way you measure X and Y distances that are plotted on a grid along with each point’s elevation or depth.
With plotted points, now you can draw contours for every foot, or every two feet, or every five feet, depending on the size of your reservoir. Then calculate the area for each contour, and the volume between each set of contours.
Here’s where Google Earth can be your best friend. Navigate to your property and reservoir in Google Earth. Then take a digital photo of your contour map, and import it into Google Earth as an image overlay. Make it 50 percent transparent, and move and resize the image until it fits over your reservoir. Now you can use the polygon tool, trace over your contours, and let Google Earth calculate the areas for you! Make sure to get those areas in square feet or acres and not square miles.
An alternative way of doing this is to print out a map of your reservoir from Google Earth, then draw your survey points and contours right on that map. Then when you import the scanned or photographed, edited map, it will be a lot easier to overlay on your reservoir.
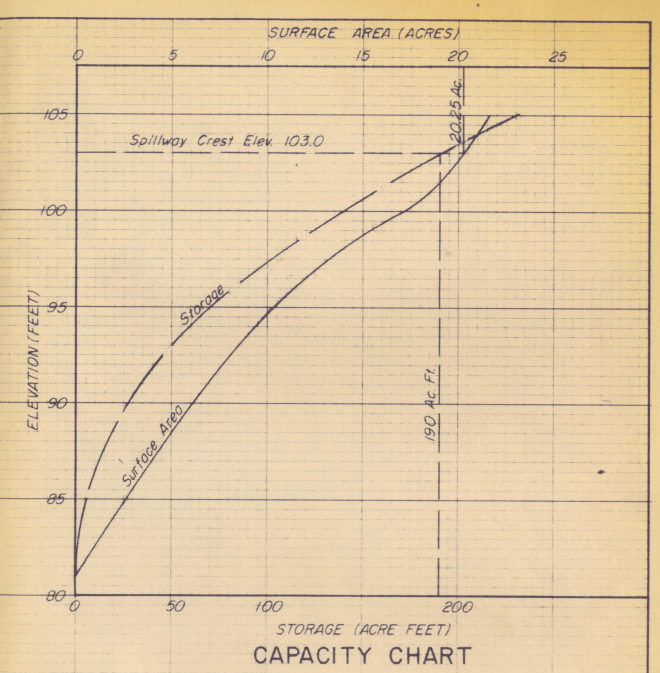
Make an elevation-storage table and draw an elevation-storage curve like the one below.
Let’s look at an example. To get the reservoir volume, add the areas of two adjacent contours, say, the 90-foot contour and the 92-foot contour, divide by 2, then multiply by the elevation difference (in this case, 2 feet). If the 90-foot contour has an area of 6.1 acres, and the 92-foot contour has an area of 7.6 acres, the calculation is [(6.1 + 7.6) / 2] * 2 = 13.7 AF.
Here’s the great thing about simple methods: anyone can measure his own reservoir by reading up on it first (Google, Bing, or DuckDuckGo) and then taking some care (and good notes) to do the job well. If the topography is difficult, or the pond is too large for tapes, or you are just too busy doing the work you have to get done, then talk with an engineer and negotiate cost vs. quality and accuracy.


 transducers with data collectors), in-line meters, in-line differential pressure, how to determine and track reservoir volume, and how to report changes in volume.

 logger?


